The Green HPCG List
SC18 is in the books now and the latest TOP500 results are out. Perfect time for some play with numbers!
This post will focus one efficiency, in terms of performance per Watt, simply because system power envelope is a major constrain for upcoming Exascale systems. With the great numbers from TOP500, we try to extend theoretical estimates from theoretical Flop/Ws of individual compute hardware to system scale.
Of course, we do have the Green 500, but let us compare something different this time…
HPCG
Since recently, an additional benchmark complementing raw LINPACK performance (TOP500 metric) on systems was introduced called HPCG. The High Performance Conjugate Gradients benchmark project computes a conjugate gradient (CG) method which is contrary to the dense matrix operations in LINPACK a sparse task.
Why would this be interesting? Besides the official list of reasons on the project page and the use of the method itself for e.g. solving long-range potentials, CG is a good measure for many kinds of finite stencil-based codes such as fluid solvers, FDTD solvers, finite element solvers and the like.
CG is, contrary to LINPACK, quickly memory bound and reasonably communication intensive at scale, just like most real-world science problems. That means for a system benchmark, well-designed networking and per-node performance (fat nodes) get a bigger role in order to push down latencies.
Last but not least, as far as I am aware, CG does not benefit from the recently introduced tensor cores in Nvidia’s Volta generation. (Simply because those cores are also made for dense matrix-matrix operations and packing overhead and reduction of parallelism in blocks does not play well when also calculating a lot of zeros.) LINPACK, or to be more precise the multi-node implementation HPL, does not use tensor cores yet either, but research is done in that field.
So all-in-all, HPCG as the Flop/s measure for an energy comparison seems to be an exciting and somewhat fair starting point to look at.
Method for an (Unofficial) “Green HPCG”
So let us take the official HPCG list and calculate a “Green HPCG” from it. Why should LINPACK be the only metric for Flop/s and efficiency? This “unofficial” list is just like the official Green500 list, but swapping LINPACK Flop/s for HPCG Flop/s.
Of course, data was not complete: not all HPCG (and even TOP500) candidates submit power and not all Green 500 listings have a HPCG submission.
And the Winner is …
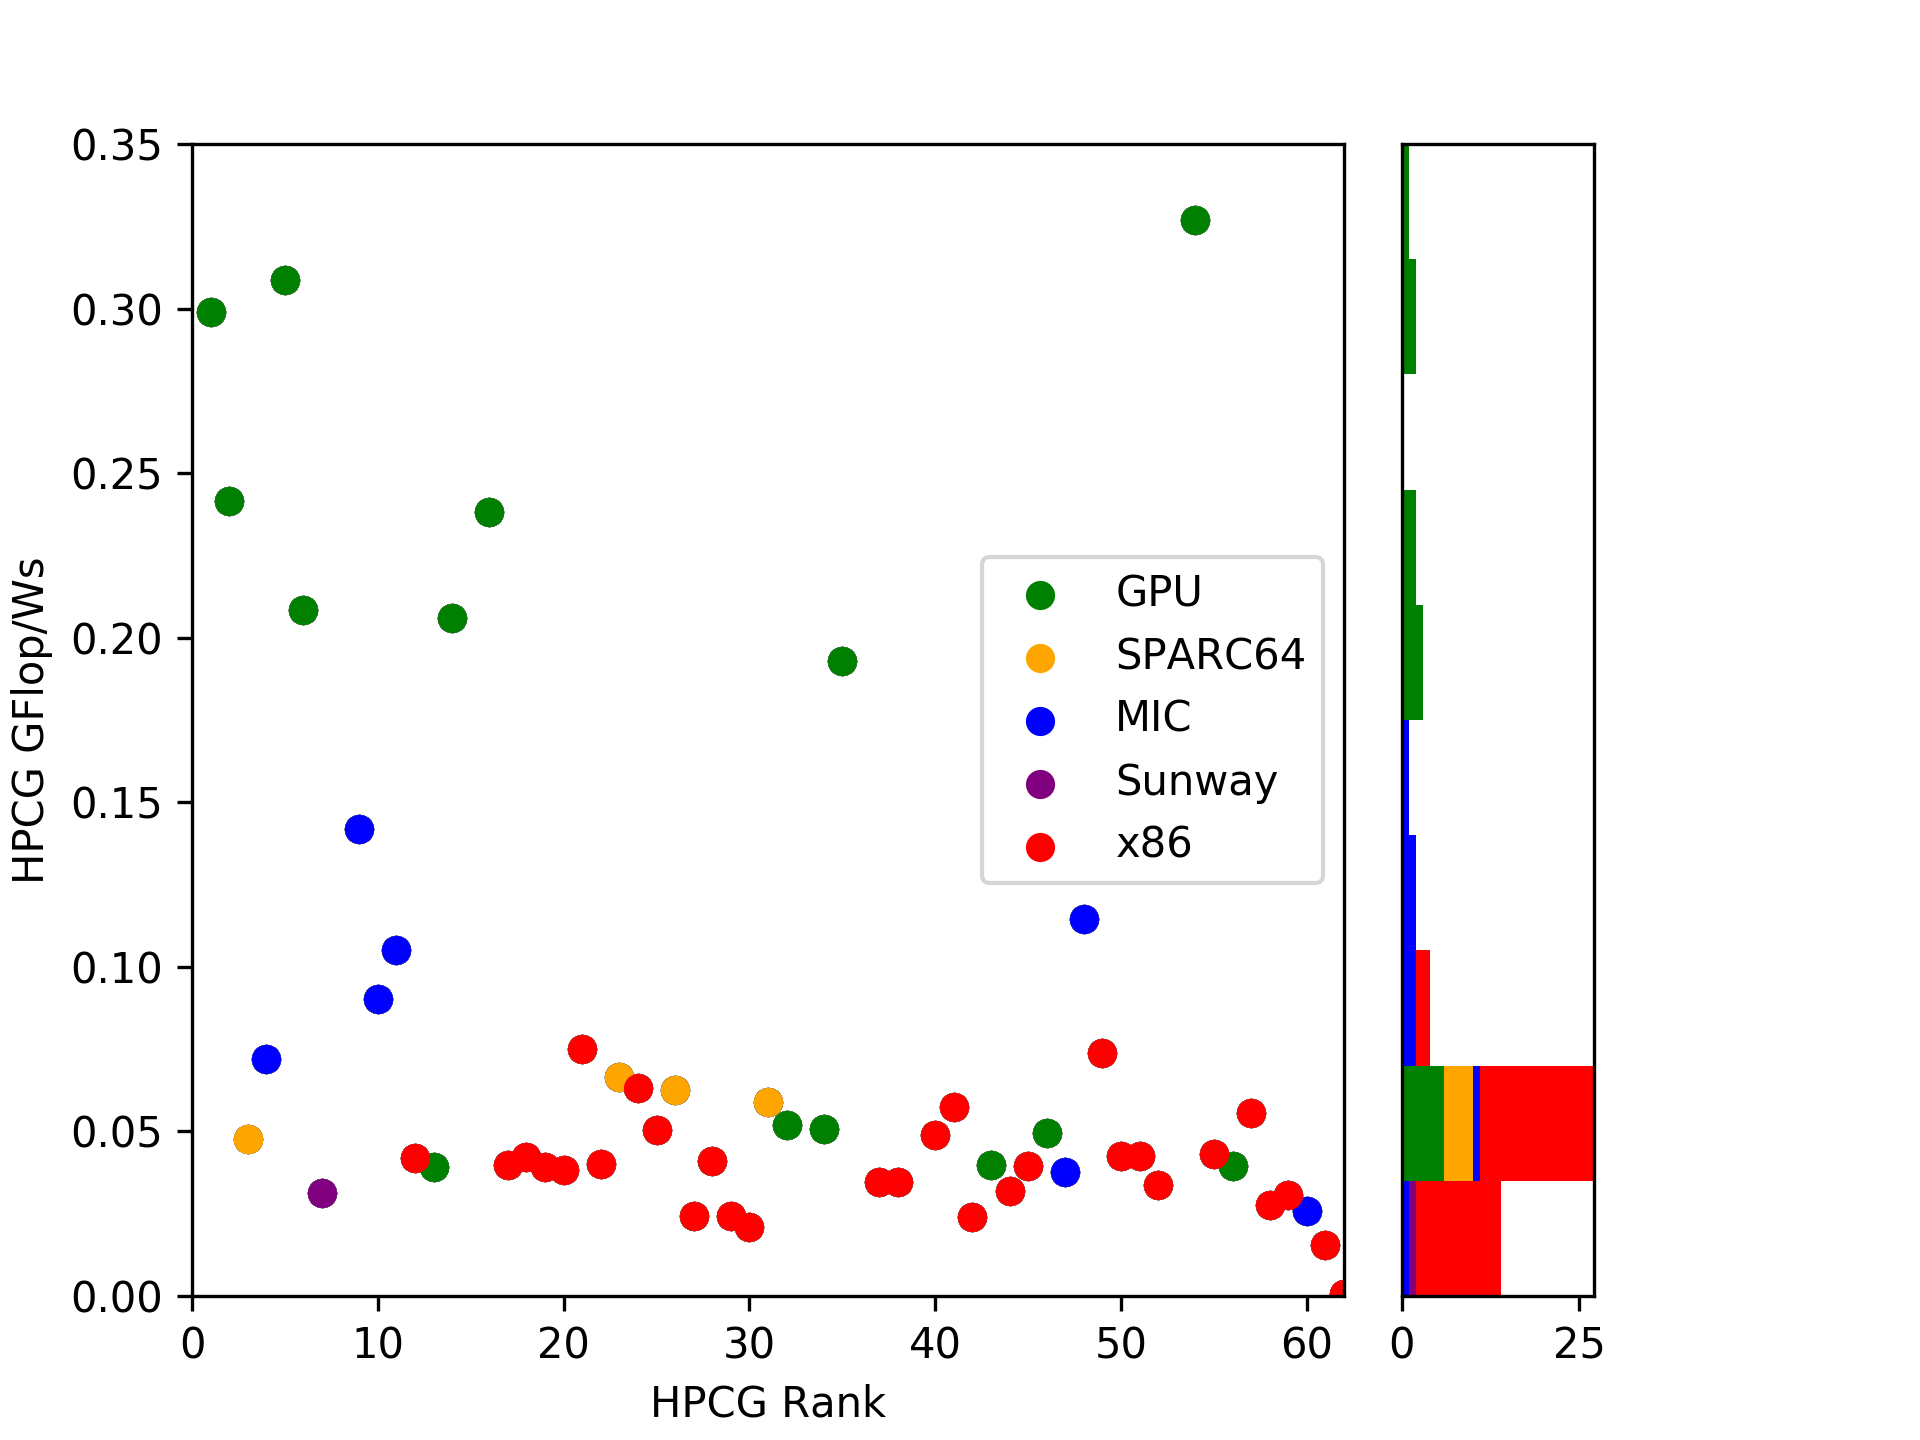
MareNostrum P9 CTE with 327 MFlop/Ws! A system at rank 411 in the TOP500! Positioned slightly before AI Bridging Cloud (309 MFlop/Ws) and Summit (299 MFlop/Ws).
Sierra is on place four with 241 MFlop/Ws - interesting difference for a Summit-twin.
The list goes on with recent GPU systems until Xeon Phi (MIC) kicks in at 142 MFlop/Ws for Oakforest-PACS and the best x86 system, BSC with MareNostrum again (!), with 75 MFlop/Ws.
| HPCG Rank | LINPACK Rank | System | GFlop/Ws | Arch | Launch |
|---|---|---|---|---|---|
| 54 | 411 | MareNostrum P9 CTE- IBM Power System AC922 IBM... | 0.326807 | GPU | 06/2018 |
| 5 | 7 | AI Bridging Cloud Infrastructure (ABCI)- PRIME... | 0.308534 | GPU | 06/2018 |
| 1 | 1 | Summit- IBM Power System AC922 IBM POWER9 22C ... | 0.299065 | GPU | 06/2018 |
| 2 | 2 | Sierra- IBM Power System S922LC IBM POWER9 22C... | 0.241418 | GPU | 06/2018 |
| 16 | 22 | TSUBAME3,0- SGI ICE XA IP139-SXM2 Xeon E5-2680... | 0.238133 | GPU | 06/2017 |
| 6 | 5 | Piz Daint- Cray XC50 Xeon E5-2690v3 12C 2,6GHz... | 0.208444 | GPU | 11/2016 |
| 14 | 15 | HPC4- Proliant DL380 Gen10 Xeon Platinum 8160 ... | 0.205962 | GPU | 06/2018 |
| 35 | 51 | DGX Saturn V- NVIDIA DGX-1 Xeon E5-2698v4 20C ... | 0.192904 | GPU | 11/2016 |
| 9 | 14 | Oakforest-PACS- PRIMERGY CX1640 M1 Intel Xeon ... | 0.141788 | MIC | 11/2016 |
| 48 | 243 | JOLIOT-CURIE KNL- Bull Sequana X1000 Intel Xeo... | 0.114417 | MIC | 06/2018 |
| 11 | 16 | Tera-1000-2- Bull Sequana X1000 Intel Xeon Phi... | 0.105022 | MIC | 06/2018 |
| 10 | 12 | Cori- Cray XC40 Intel Xeon Phi 7250 68C 1,4GHz... | 0.090236 | MIC | 11/2016 |
| 21 | 25 | MareNostrum- Lenovo SD530 Xeon Platinum 8160 2... | 0.074902 | x86 | 06/2017 |
| 49 | 91 | ATERUI II - Cray XC50 Xeon Gold 6148 20C 2,4GH... | 0.073892 | x86 | 06/2018 |
| 4 | 6 | Trinity- Cray XC40 Xeon E5-2698v3 16C 2,3GHz I... | 0.072066 | MIC | 11/2017 |
| 23 | 56 | SORA-MA- Fujitsu PRIMEHPC FX100 SPARC64 XIfx 3... | 0.066667 | SPARC64 | 06/2015 |
| 24 | 33 | Electra- HPE SGI 8600/SGI ICE-X E5-2680V4/ Xeo... | 0.063201 | x86 | 11/2018 |
| 26 | 63 | Fujitsu PRIMEHPC FX100 SPARC64 XIfx 32C 2,2GHz... | 0.062594 | SPARC64 | 11/2015 |
| 31 | 84 | Plasma Simulator- Fujitsu PRIMEHPC FX100 SPARC... | 0.058843 | SPARC64 | 06/2015 |
| 41 | 40 | JOLIOT-CURIE SKL- Bull Sequana X1000 Xeon Plat... | 0.057448 | x86 | 06/2018 |
| 57 | 361 | Falcon- SGI ICE X Xeon E5-2695v4 18C 2,1GHz In... | 0.055593 | x86 | 11/2017 |
| 32 | 69 | TSUBAME 2,5- Cluster Platform SL390s G7 Xeon X... | 0.051859 | GPU | 06/2014 |
| 34 | 44 | JURECA- T-Platforms V-Class/Dell C6320P E5-268... | 0.050800 | GPU | 11/2017 |
| 25 | 36 | Cheyenne- SGI ICE XA Xeon E5-2697v4 18C 2,3GHz... | 0.050539 | x86 | 11/2016 |
| 46 | 131 | Prometheus- HP Apollo 8000 Xeon E5-2680v3 12C ... | 0.049455 | GPU | 11/2015 |
| 40 | 253 | iDataPlex DX360M4 Intel Xeon E5-2680v2 10C 2,8... | 0.048786 | x86 | 11/2013 |
| 3 | 18 | K computer SPARC64 VIIIfx 2,0GHz Tofu intercon... | 0.047610 | SPARC64 | 11/2011 |
| 55 | 246 | Cobalt- bullx DLC 720 Xeon E5-2680v4 14C 2,4GH... | 0.043080 | x86 | 06/2016 |
| 50 | 90 | Beaufix2- bullx DLC 720 Xeon E5-2698v4 20C 2,2... | 0.042580 | x86 | 11/2016 |
| 51 | 89 | Prolix2- bullx DLC 720 Xeon E5-2698v4 20C 2,2G... | 0.042570 | x86 | 06/2016 |
| 18 | 21 | Mira- BlueGene/Q Power BQC 16C 1,60GHz Custom ... | 0.042345 | x86 | 06/2012 |
| 12 | 10 | Sequoia- BlueGene/Q Power BQC 16C 1,60 GHz Cus... | 0.041872 | x86 | 06/2012 |
| 28 | 39 | Vulcan- BlueGene/Q Power BQC 16C 1,600GHz Cust... | 0.041019 | x86 | 06/2013 |
| 22 | 32 | Shaheen II- Cray XC40 Xeon E5-2698v3 16C 2,3GH... | 0.040180 | x86 | 05/2015 |
| 43 | 55 | HPC2- iDataPlex DX360M4 Intel Xeon E5-2680v2 1... | 0.039853 | GPU | 06/2014 |
| 17 | 27 | Pleiades- SGI ICE X Intel Xeon E5-2670/E5-2680... | 0.039750 | x86 | 11/2016 |
| 56 | 271 | Graham- Huawei X6800 V3 Xeon E5-2683 v4 16C 2,... | 0.039539 | GPU | 06/2017 |
| 45 | 62 | Mistral- bullx DLC 720 Xeon E5-2680v3 12C 2,5G... | 0.039525 | x86 | 06/2016 |
| 13 | 9 | Titan- Cray XK7 Opteron 6274 16C 2,200GHz Cray... | 0.039264 | GPU | 11/2012 |
| 19 | 34 | Pangea- SGI ICE X Xeon Xeon E5-2670/ E5-2680v3... | 0.039202 | x86 | 06/2016 |
| 20 | 30 | Hazel Hen- Cray XC40 Xeon E5-2680v3 12C 2,5GHz... | 0.038174 | x86 | 11/2014 |
| 47 | 92 | Tianhe-2 LvLiang Solution- Tianhe-2 LvLiang In... | 0.037723 | MIC | 11/2014 |
| 38 | 42 | Cray XC40 Xeon E5-2695v4 18C 2,1GHz Aries inte... | 0.034507 | x86 | 06/2016 |
| 37 | 43 | Cray XC40 Xeon E5-2695v4 18C 2,1GHz Aries inte... | 0.034507 | x86 | 06/2016 |
| 52 | 105 | Tera-1000-1- bullx DLC 720 Xeon E5-2698v3 16C ... | 0.033772 | x86 | 06/2016 |
| 44 | 77 | occigen2- bullx DLC 720 Xeon E5-2690v4 14C 2,6... | 0.031797 | x86 | 06/2017 |
| 7 | 3 | Sunway TaihuLight- Sunway MPP Sunway SW26010 2... | 0.031283 | Sunway | 06/2016 |
| 59 | 230 | Sid- bullx DLC 720 Xeon E5-2695v4 18C 2,1GHz I... | 0.030718 | x86 | 06/2016 |
| 58 | 360 | Cartesius 2- Bullx DLC B710/B720 Blades Xeon E... | 0.027578 | x86 | 06/2015 |
| 60 | 212 | Endeavor- Intel Cluster Intel Xeon Gold 6148/X... | 0.025893 | MIC | 11/2017 |
| 29 | 186 | ARCHER- Cray XC30 Intel Xeon E5 v2 12C 2,700GH... | 0.024436 | x86 | 11/2014 |
| 27 | 64 | SuperMUC- iDataPlex DX360M4 Xeon E5-2680 8C 2,... | 0.024338 | x86 | 06/2012 |
| 42 | 231 | Curie thin nodes- Bullx B510 Xeon E5-2680 8C 2... | 0.023917 | x86 | 06/2012 |
| 30 | 134 | Edison- Cray XC30 Intel Xeon E5-2695v2 12C 2,4... | 0.020987 | x86 | 06/2014 |
| 61 | 416 | EAGLE- Huawei E9000 Blade Server Xeon E5-2697v... | 0.015520 | x86 | 11/2015 |
| 62 | 487 | Lomonosov- T-Platforms T-Blade2/1,1 Xeon X5570... | 0.000621 | x86 | 06/2011 |
Notes: Some systems are mixed, e.g. JURECA (11/2017 upgrade) has Kepler GPUs (2015) and Xeon Phi accelerators (2017), which is categorized as “GPU” arch (probably wrong categorization and likely benchmarked for a sub-system). For SuperMUC-NG, no official power-numbers are yet available, maybe 3-6 MW are likely (estimating 69-35 MFlop/Ws).
Trends
The top places are taken by Nvidia P100 & V100 GPUs, likely due to two reasons: a significant efficiency improvement in Pascal and Volta and (finally) the launch of multi-accelerator nodes in large systems.
(Karl, if you are reading this: let’s put new numbers in your post to falsify or proof the first point ;-) )
On the second group is taken by (2017) MIC systems. I tried to group by “launch” of systems in TOP500 submissions, looking at an evolution over time. One can see that there was already a significant gap in 2016/17 between the two which has now been widened with Knights Hill being canceled and Knights Mill (likely also a LINPACK/ML focused hardware) not yet released.
As a little surprise, the RISC architecture SPARC64 which launched in year 2011 is still amazingly well positioned. Even today, it is close to recently built x86 systems. Let’s see where the upcoming A64FX will be heading.
Sunway’s SW26010, introduced in 2016, is surprisingly low in our little comparison.
Conclusions
General purpose RISC architectures are leading in this comparison even more than in the official Green500. In that sense, it would be really interesting if a power consumption number was submitted for Sandia’s Astra (Cavium ThunderX2) cluster. But either way, is our comparison fair?
Likely not more than any other metric for calculating efficiency. But let’s assume that most scientific HPC applications lie somewhere between the official LINPACK and HPCG benchmarks, so we should consider both metrics for efficiency as well.
Data
An interactive Jupyter Notebook and the HPCG data with added system power consumption have been uploaded to DOI:10.14278/rodare.68
Enjoy playing with it!
Updates
2018-11-18 3:38PM (CET): Avoid implying that HPL is able to use FP16 tensor cores already for TOP500 benchmarks. Clarified with an additional sentence and link to a recent paper, thanks Timothy!